Temperature trends in Alaska
javi | May 7, 2025, 9:54 p.m.
The website of the Alaska Climate Reasearch Center contains a lot of interesting information about climate and meteorology in a unique place of the world. Among that information, there is available a database of temperatures recorded in several locations over the last 50-80 years.
In this post, I compare two approaches to model the trend in annual temperatures recorded in Fairbanks: a deterministic trend (linear trend) and a stochastic trend (local level model). The example sketches the idea of this paper published Climate Dynamics.
The Figure below displays monthly temperature data recorded at Fairbanks. A preliminary analysis of the data reveals the presence of a break around year 1976. As discussed in the literature, this break most likely responds to a change in the phase of the Pacific Decadal Oscilation (PDO) index. Basically, the PDO is a pattern of climate variability observed in the Pacific. As far as we are concerned in this example, it is enough to know that the PDO involves a relatively cool period before the year 1976 and a warmer period after 1976. Since Fairbanks is located in the area of influence of this phenomenon, I will include in the analysis the PDO as an independent regressor variable. In this illustrative example we could also stick to use a dummy variable for the observations up to year 1976.
The common approach to obtain a long term signal is to fit a deterministic linear trend by Ordinary Least Squares (OLS). I propose the local level model (also known as a random walk plus noise model). The results are summarized in the Figure below. The line in blue in the top graphic is the fitted deterministic linear trend for the whole sample period. Lines in red are the deterministic trends obtained in two separate subsamples before and after the year 1976 (in this case I don't include the PDO as a regressor variable).
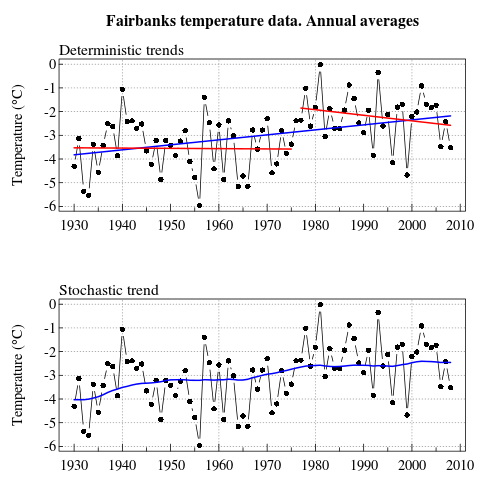
The conclusions based on each approach can be summarized as follows:
- Deterministic trend (whole sample): Temperature increased during the whole sample period at a constant rate.
- Deterministic trend (two subsamples): Two subsamples -selected according to the break determined by the PDO index- are separately analyzed. Within each subsample, temperature decreased at a constant rate, being the decrease sharper in the second regime (the warmer regime).
- Stochastic trend: There is an overall increase in temperature caused by phenomena other than the Pacific climate shift (the effect of the PDO is captured by the PDO index included as a regressor variable). The increase is sharper in the beginning of the sample; the trend is more flat in the last years of the sample.
The deterministic approach is not robust, since the sign of the slope changes with different sample periods. Besides, assuming a deterministic trend is not realistic. A linear trend is especially awkward if we extrapolate the results to the future, it will lead to an indefinitely increasing or decreasing trend, which is unlikely in this context.
In addition to the lack of plausibility of the deterministic approach, in this example a linear trend is not reliable from a statistical point of view. Runs of positive and negative values were observed in the residuals of the model, suggesting that part of the dynamics of the data remains unexplained in the residuals of the fitted model. As a consequence, OLS estimates are biased.
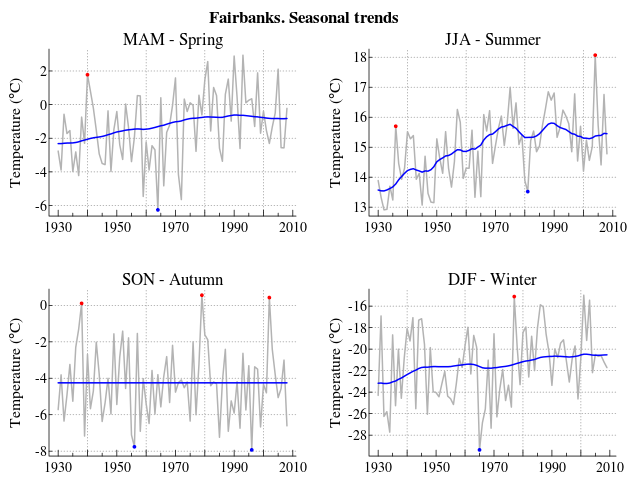
Since climate dynamics may not be homogeneous across seasons, it is interesting to split the analysis season by season. The Figure below shows the trends obtained for each season using the local level model. The points in red and blue identify the observations that were considered outliers. We can see different patterns across seasons. In particular, it is noteworthy the sharp increase in temperature observed in summer during the first decades of the sample, while the level remains constant in autumn.
This example suggests that an analysis of the long-term pattern based on deterministic trends cannot capture the dynamics in temperature data and leads to unrealistic results. A stochastic trend model provides a smooth long-term signal and is more realistic when it comes to extrapolating the results to the future.
About
This blog is part of jalobe's website.
jalobe.comThis site is currently being updated.
At present not all posts from jalobe's blog are available.